Your own data
Drop in Excel or CSV files and photos. Every sheet becomes data you can ask about straight away.
 Sign in
Talk to sales
Request an invite
Features
Ask your AI in plain words. Aria builds it, keeps it live, and puts it on every screen that has it open.
Headline numbers with their trend, gauges against a target, bars, lines, areas, pies, tables, heat tables, scatter plots, waterfalls, flows, calendars, treemaps and bar races. Every card says where its numbers come from.
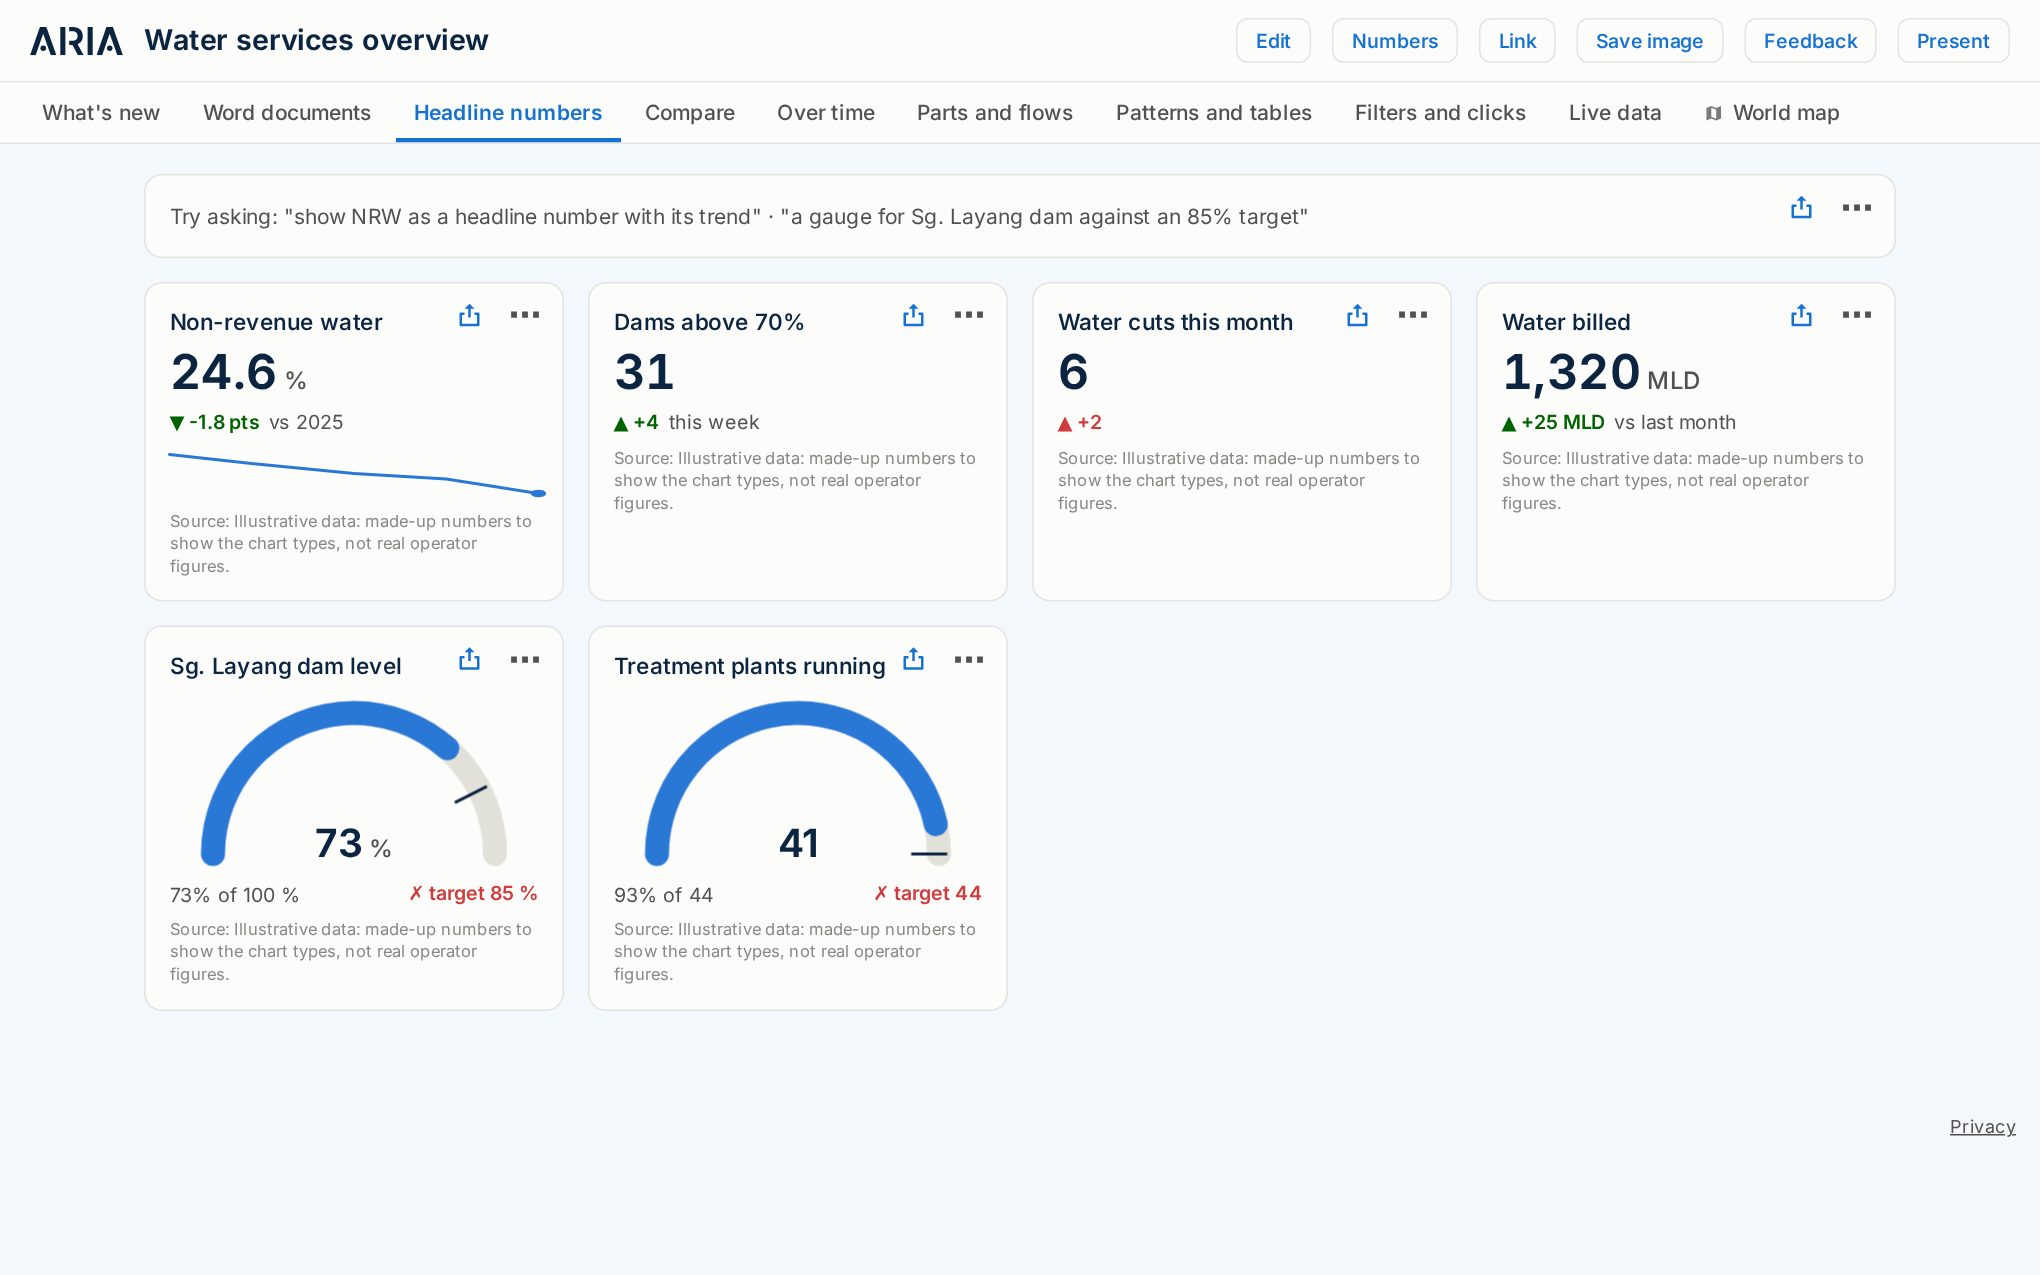
Rank things, draw the target line, split one chart into small ones per item, and let people tap a bar to filter the rest of the page.
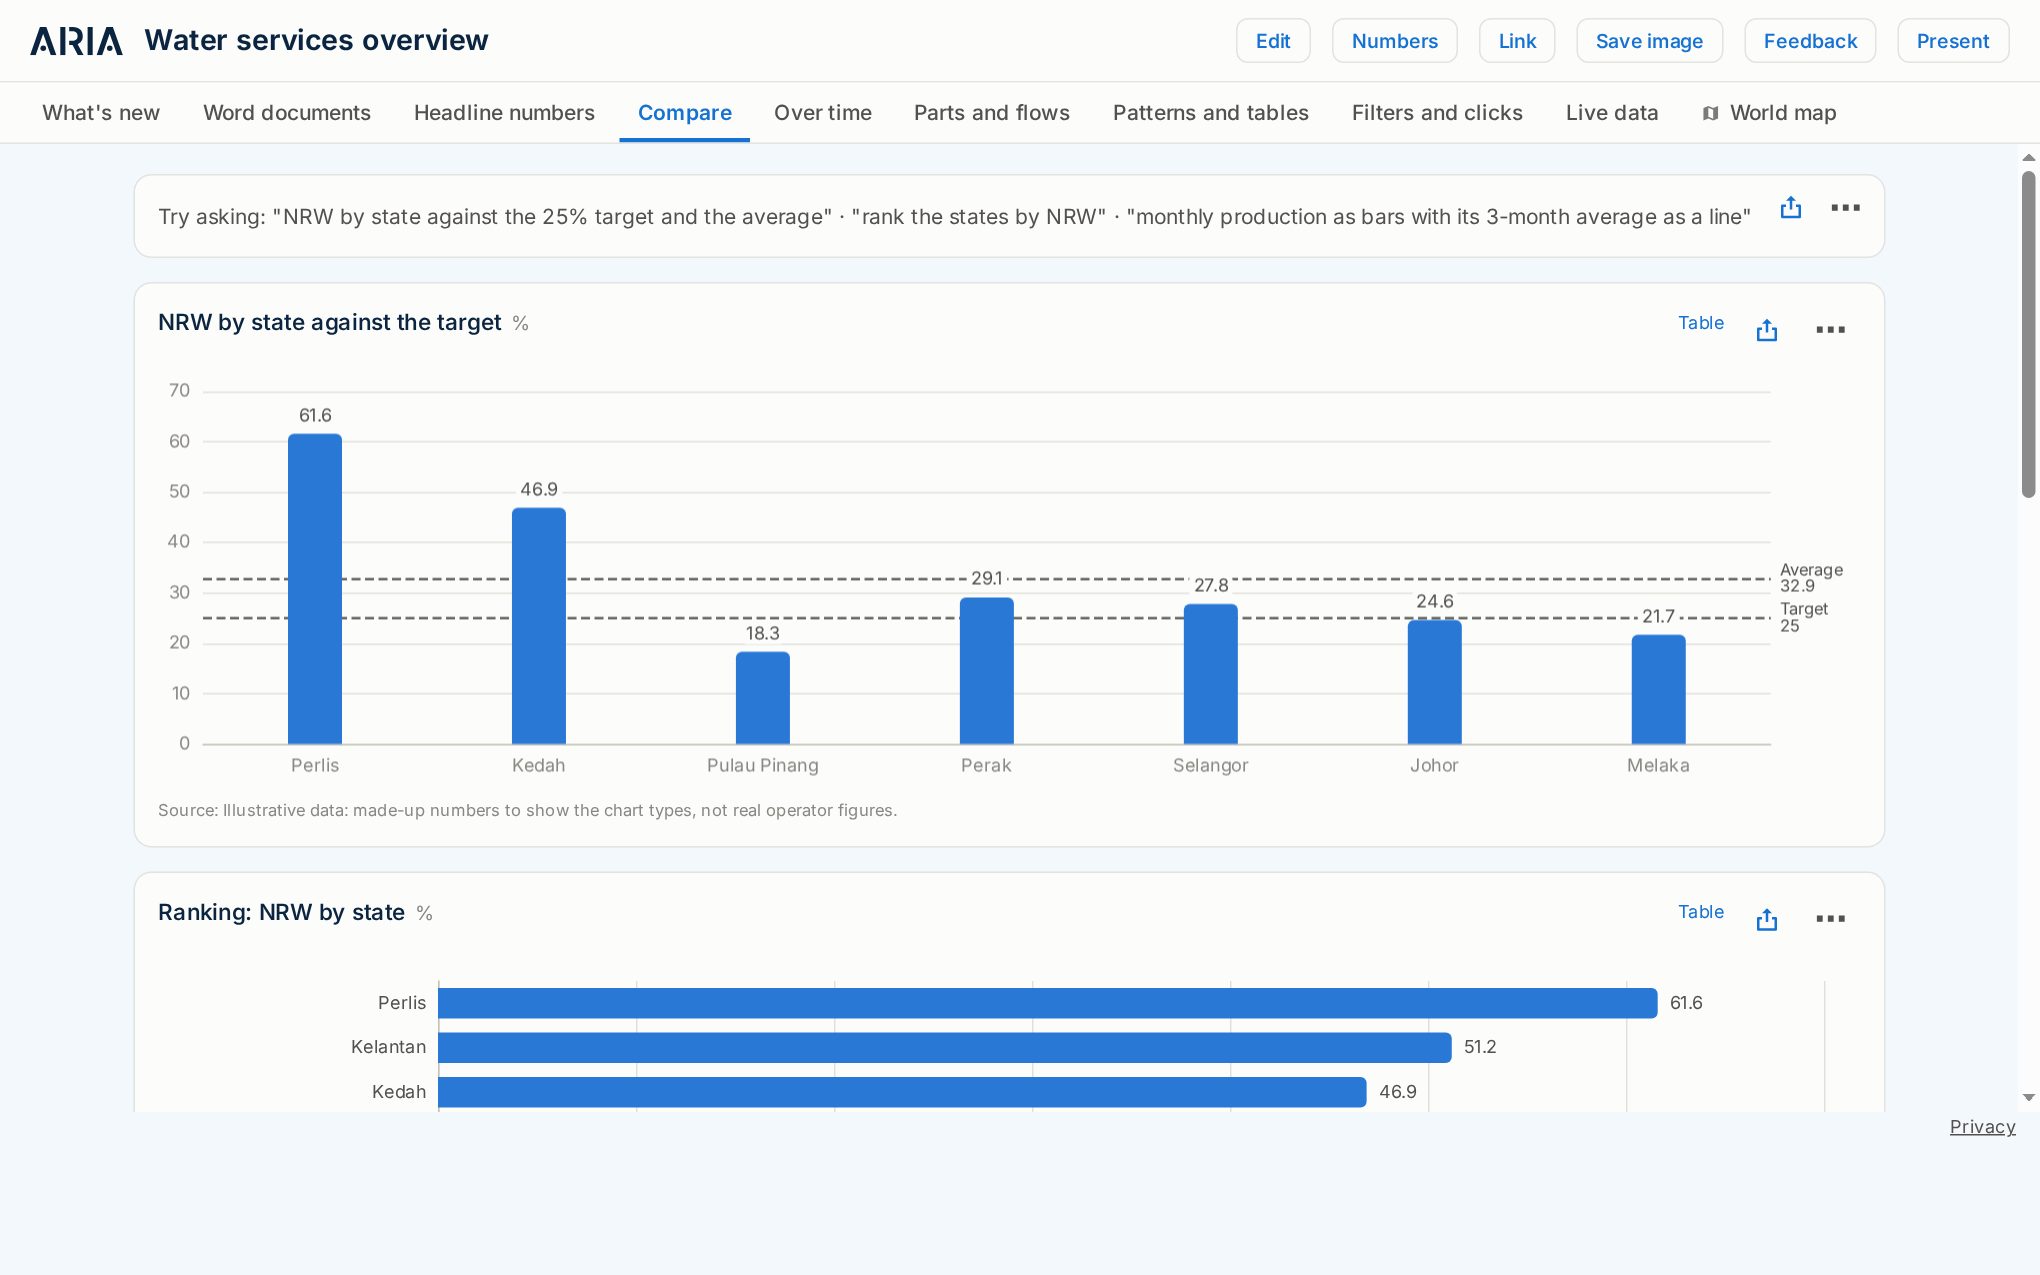
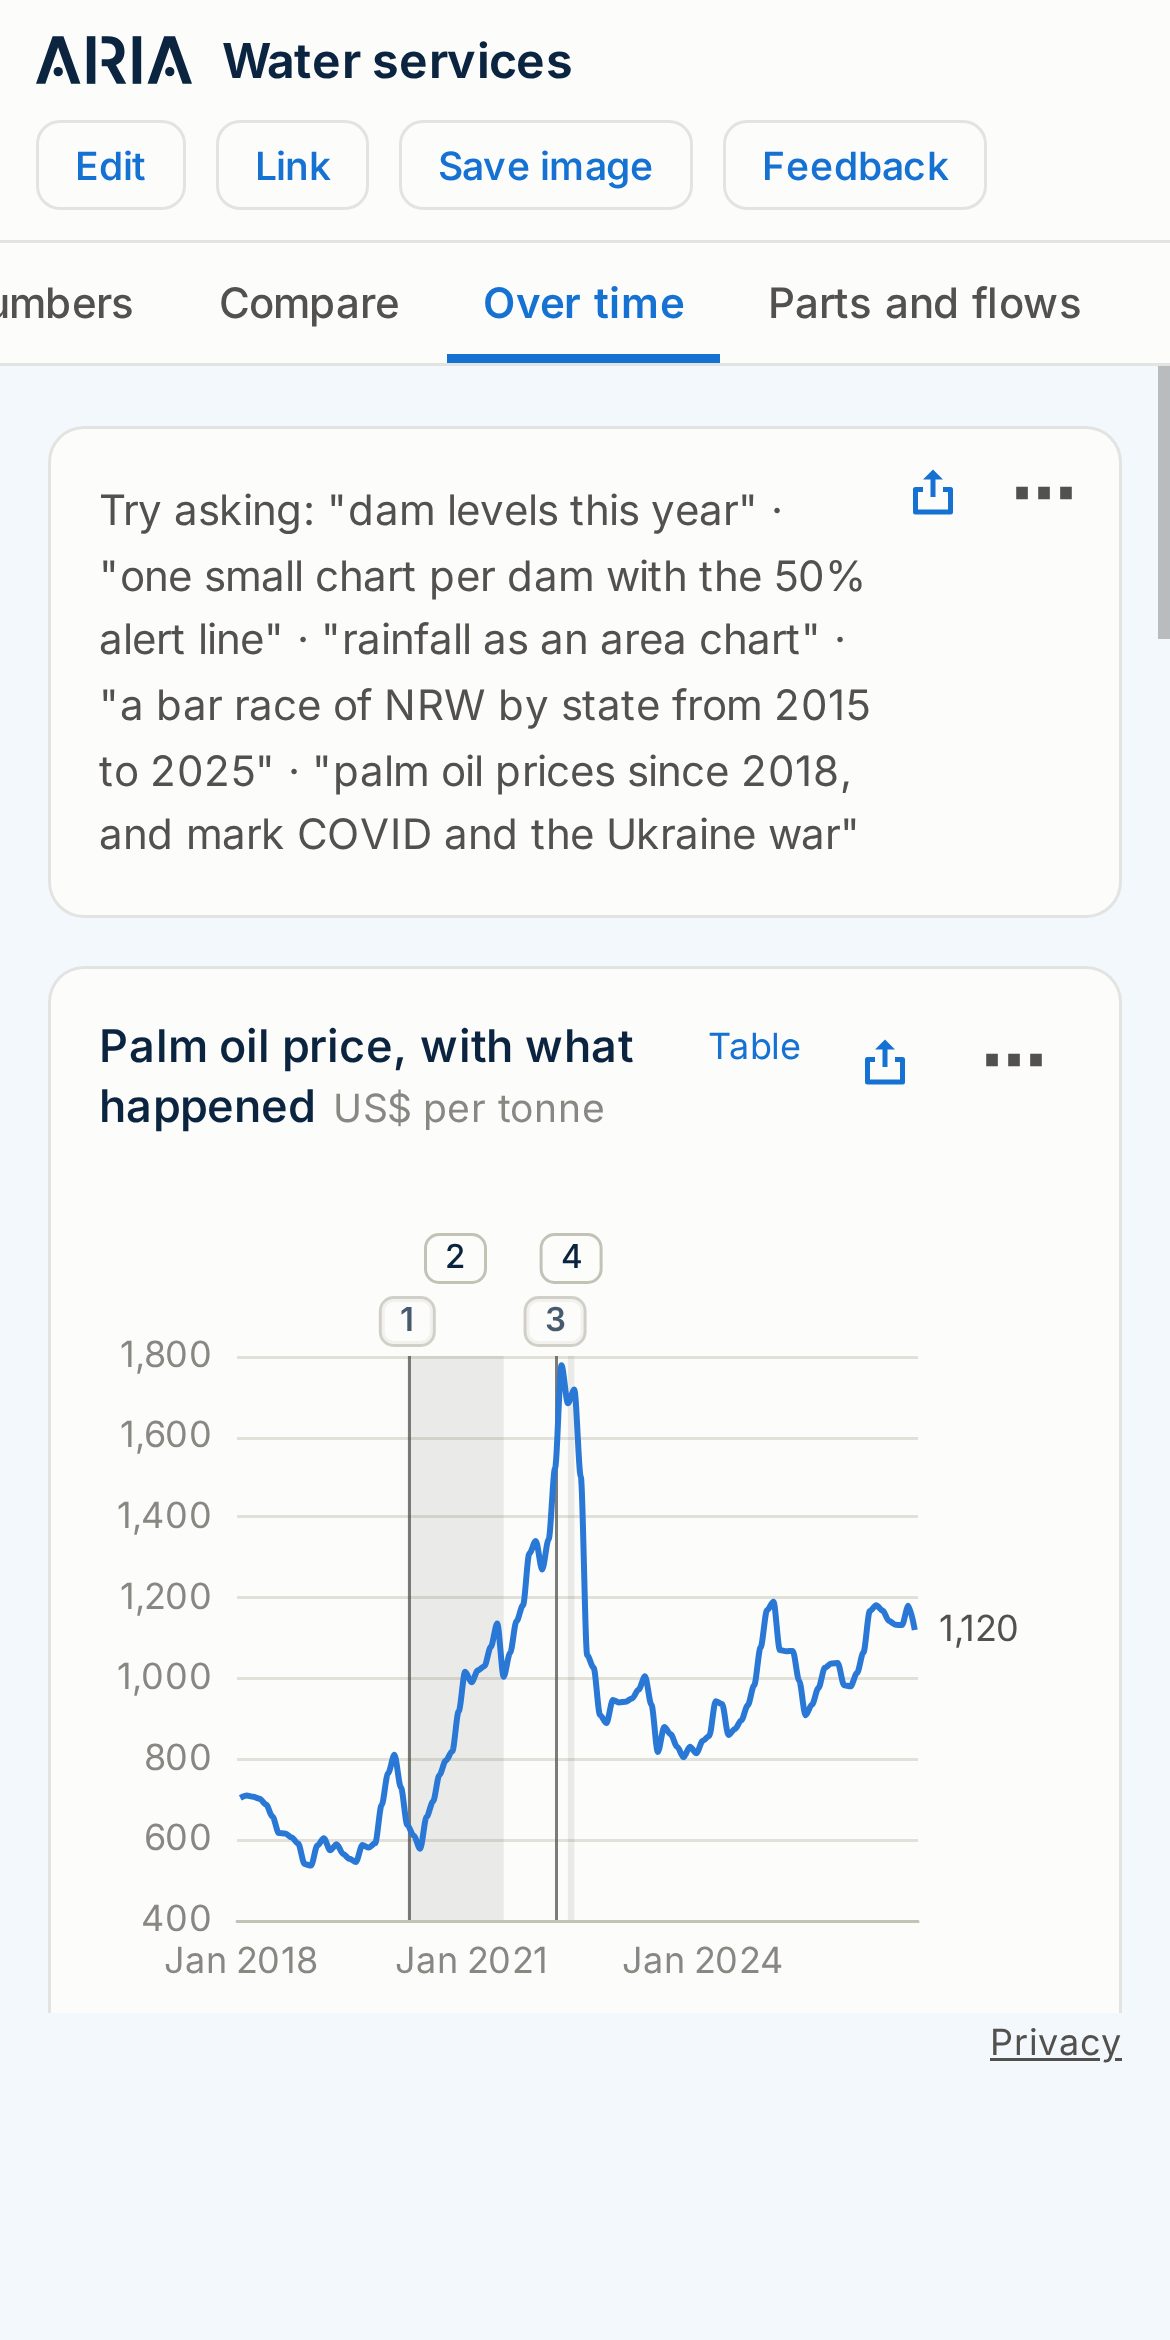
Mark events and periods on a timeline so the chart explains itself: a pandemic, a policy change, a dry spell.
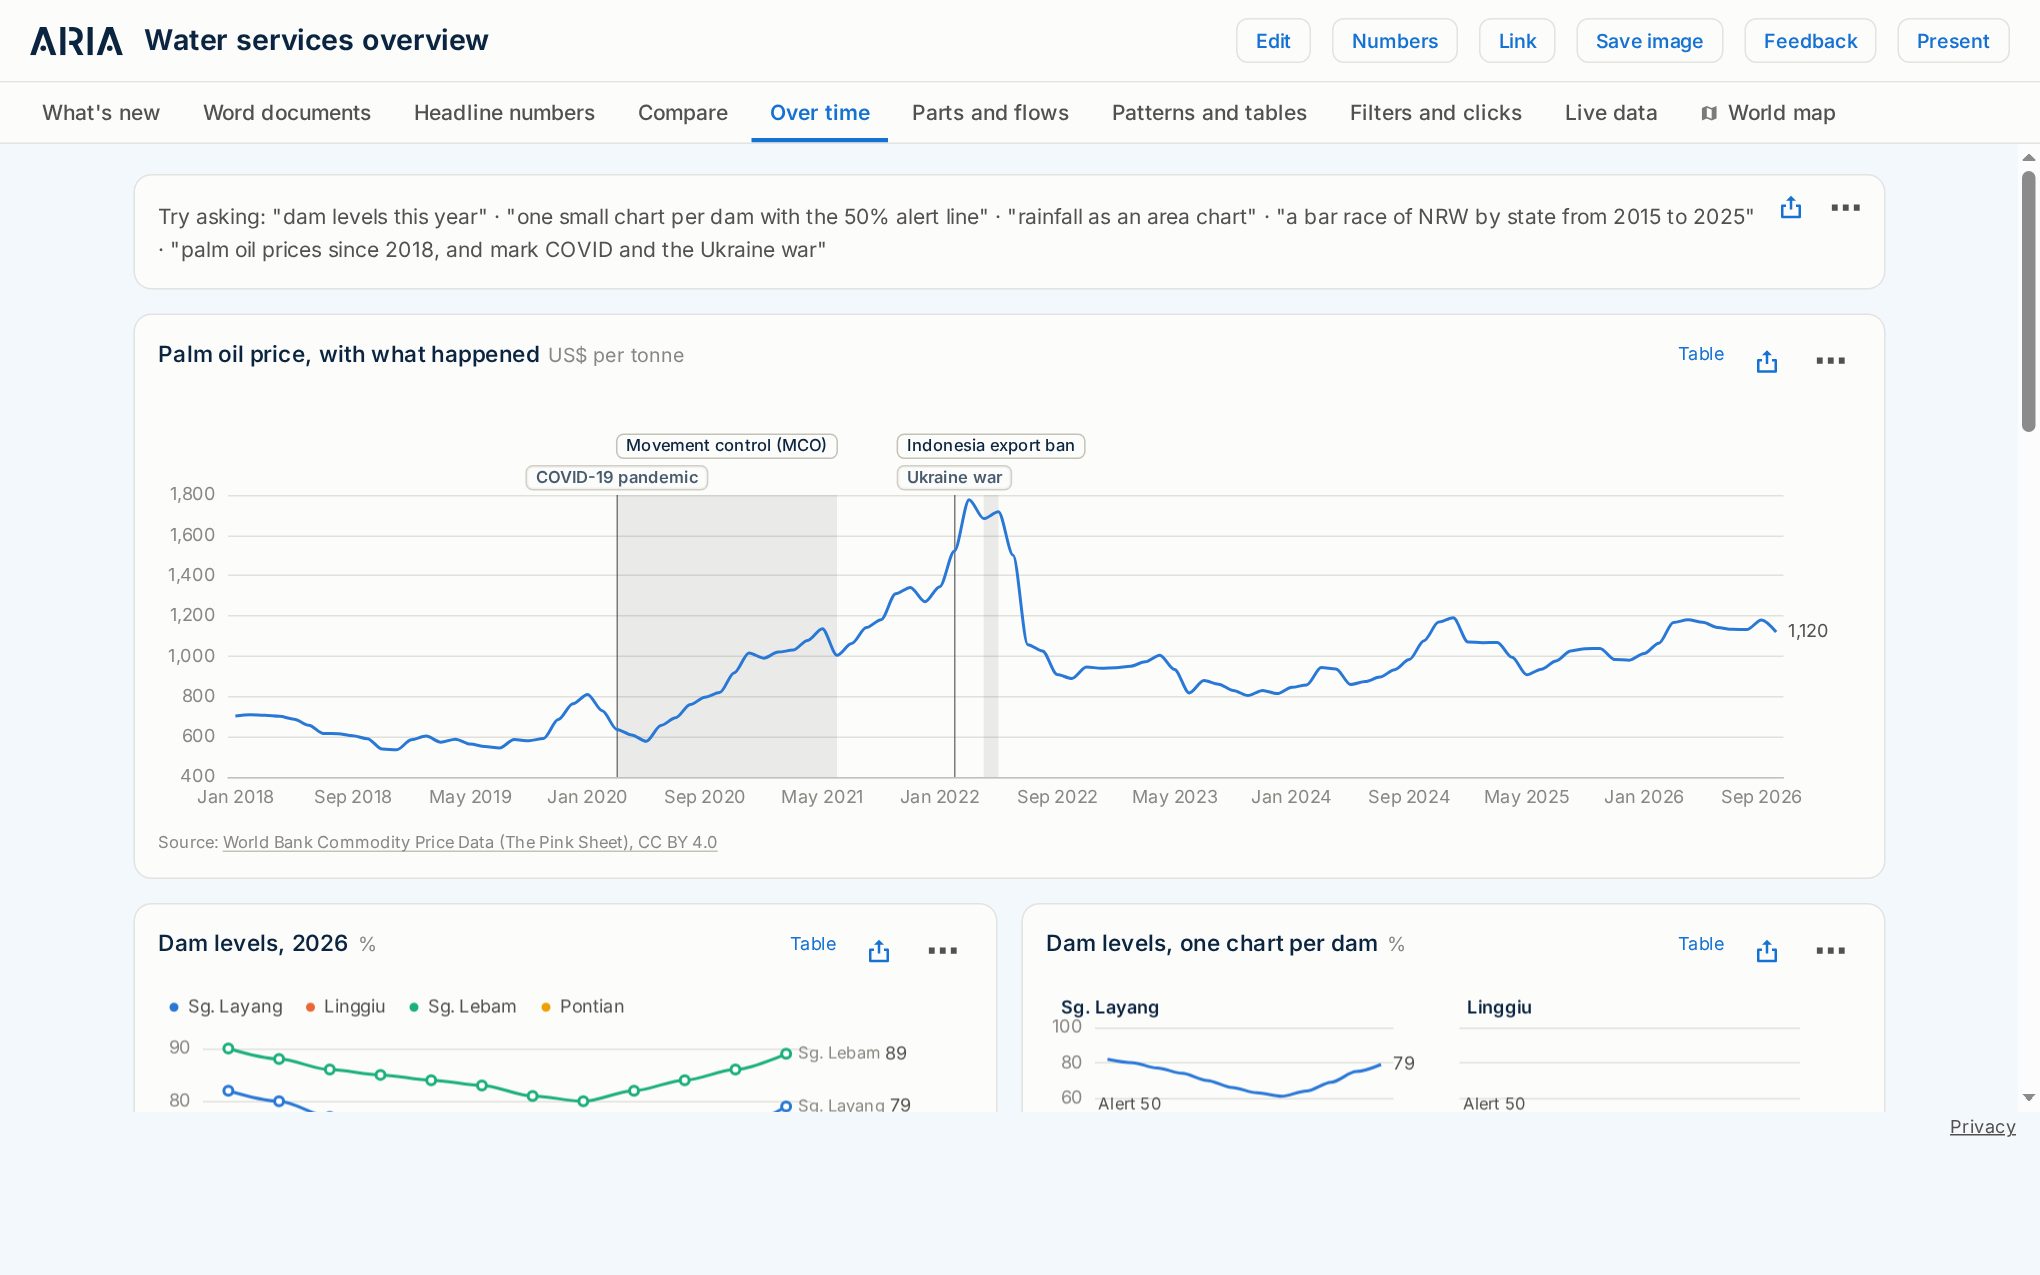
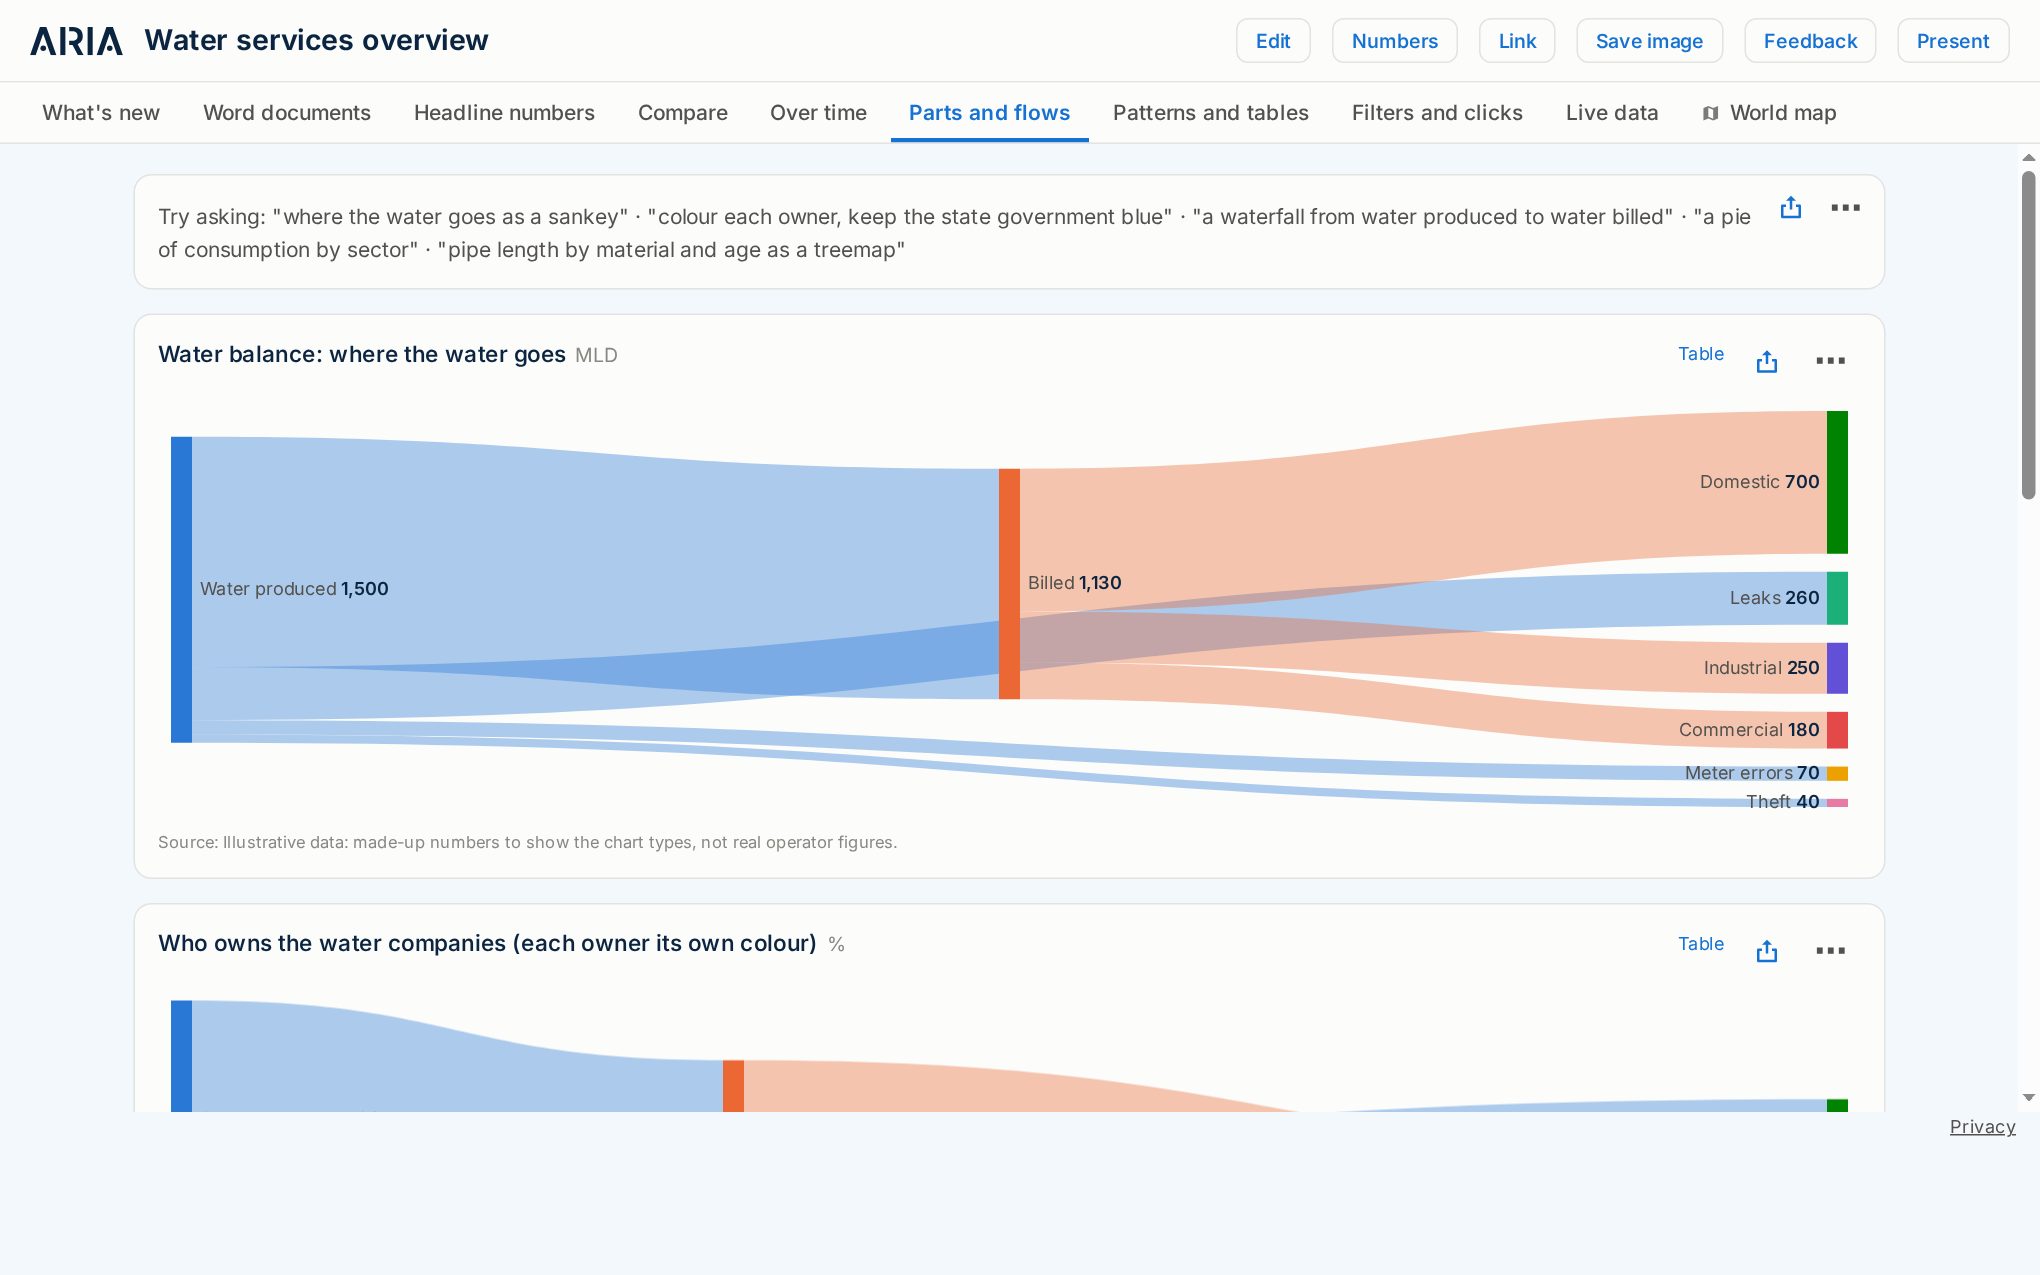
See where things go with flow (Sankey) charts, how a total breaks down with waterfalls and treemaps, and shares with pies.
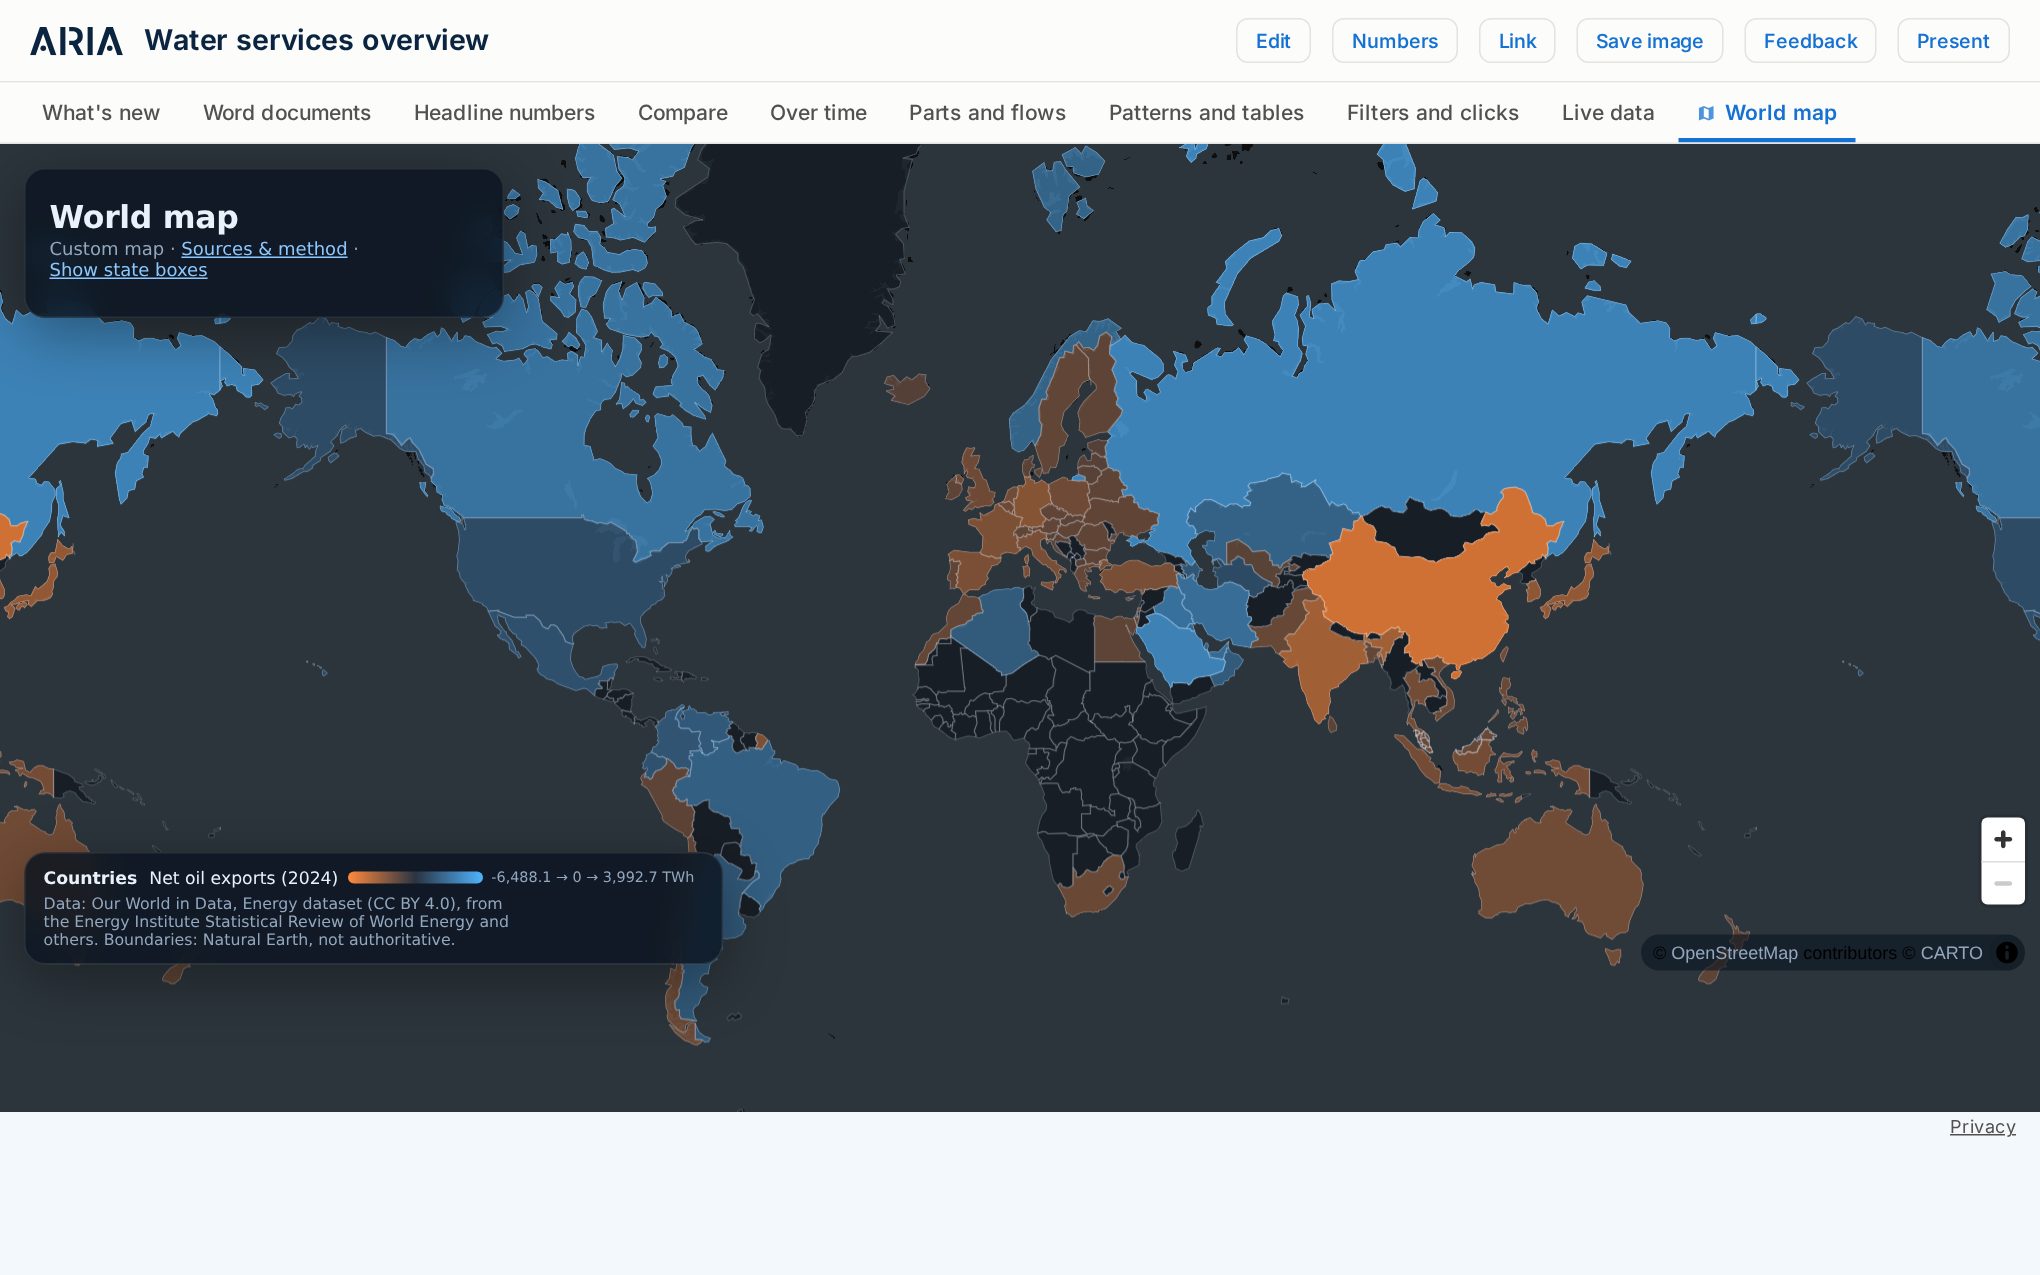
Shade countries or states, drop your own pins (with photos), circles and routes, show live buses, and play a map tour that waits for you to say “next stop”.
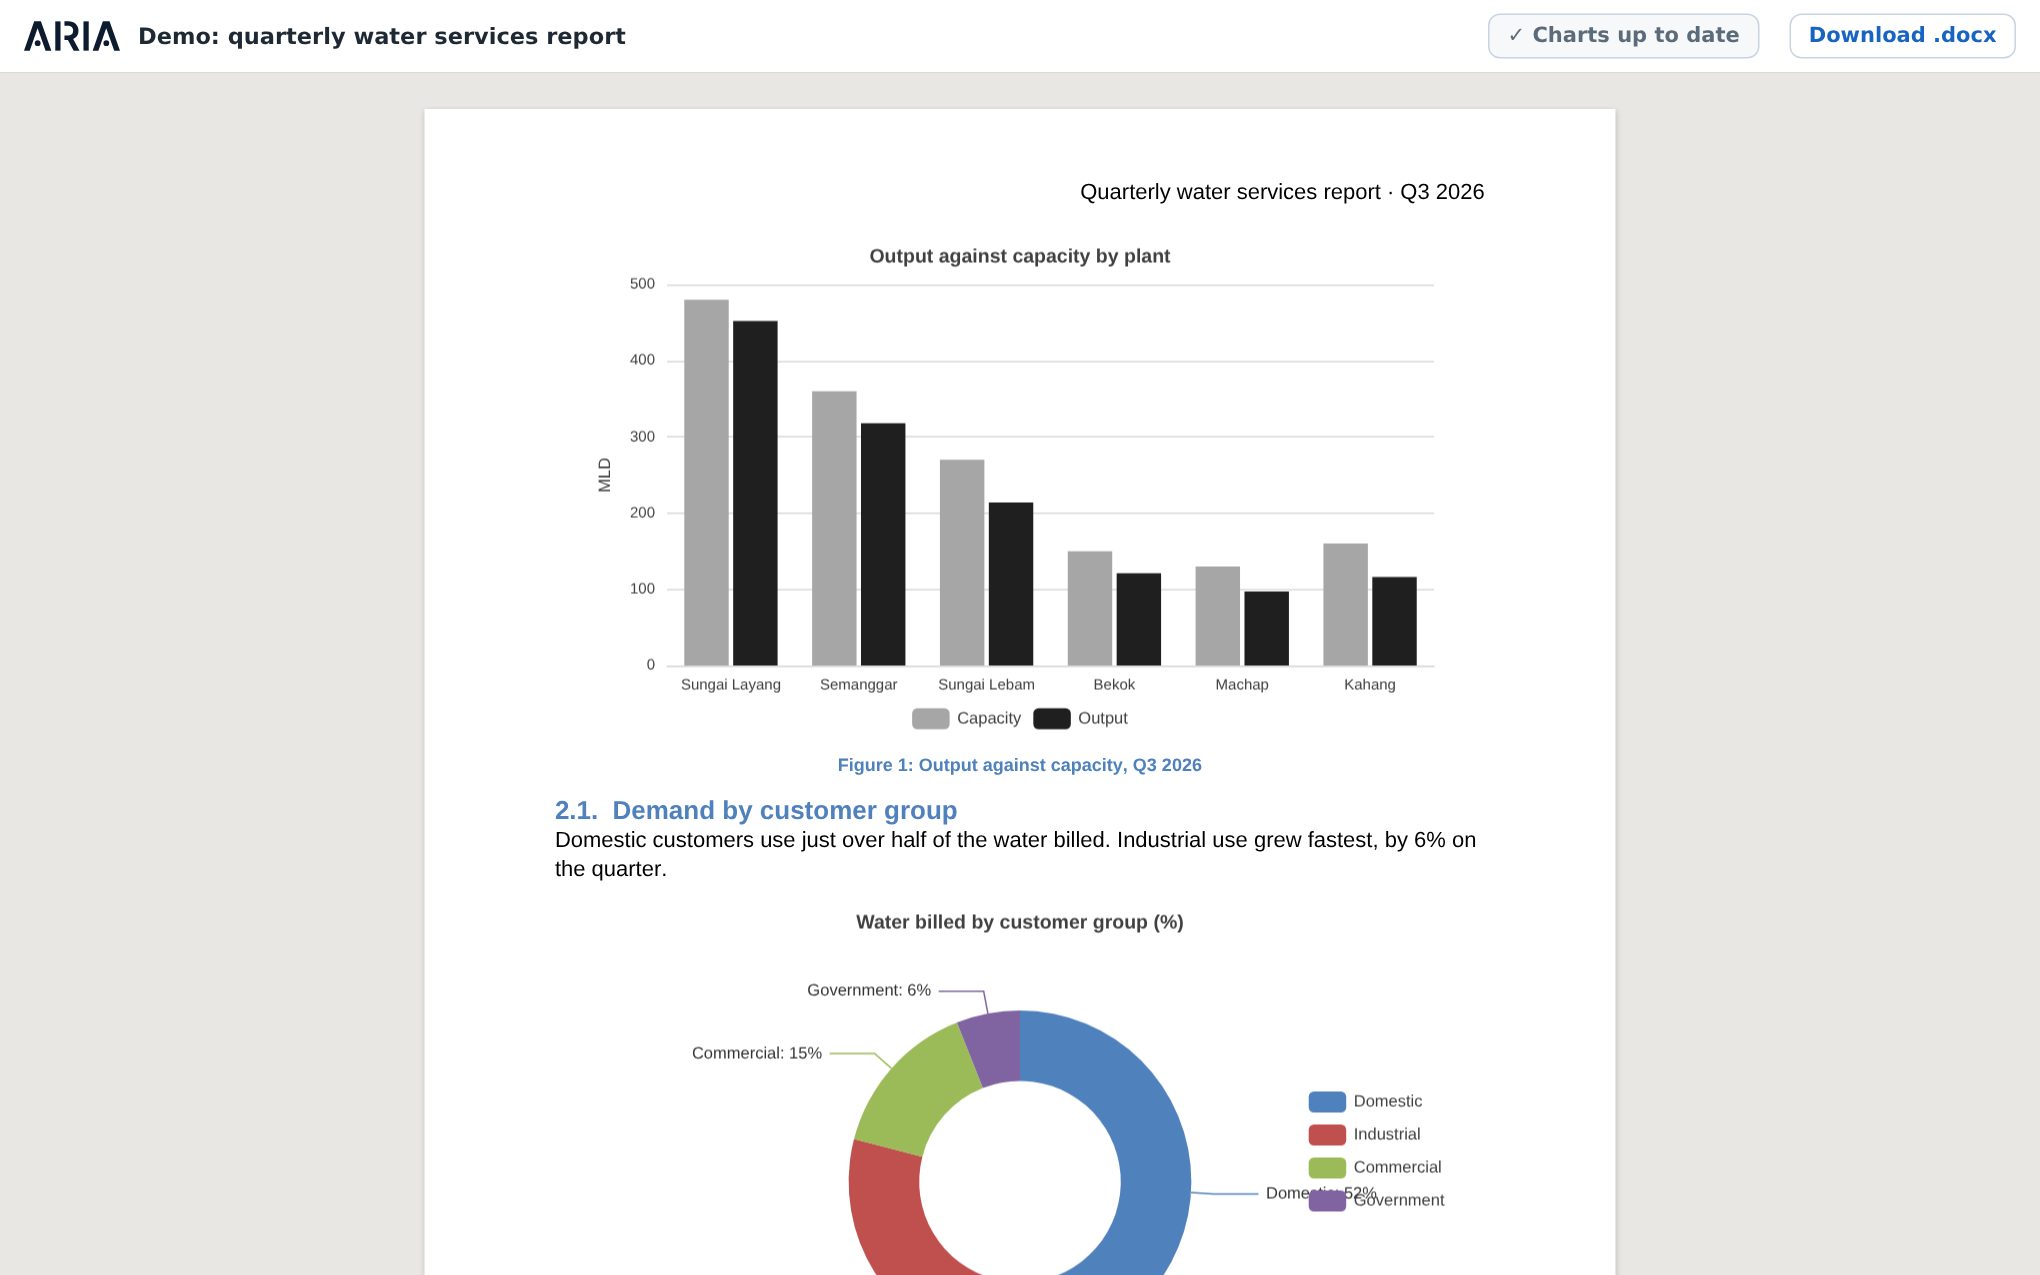
Aria writes and edits real .docx files as you talk: headings numbered the way you want, tables, real Word charts, footnotes, headers and contents. Charts taken from a dashboard stay linked and update with one click.
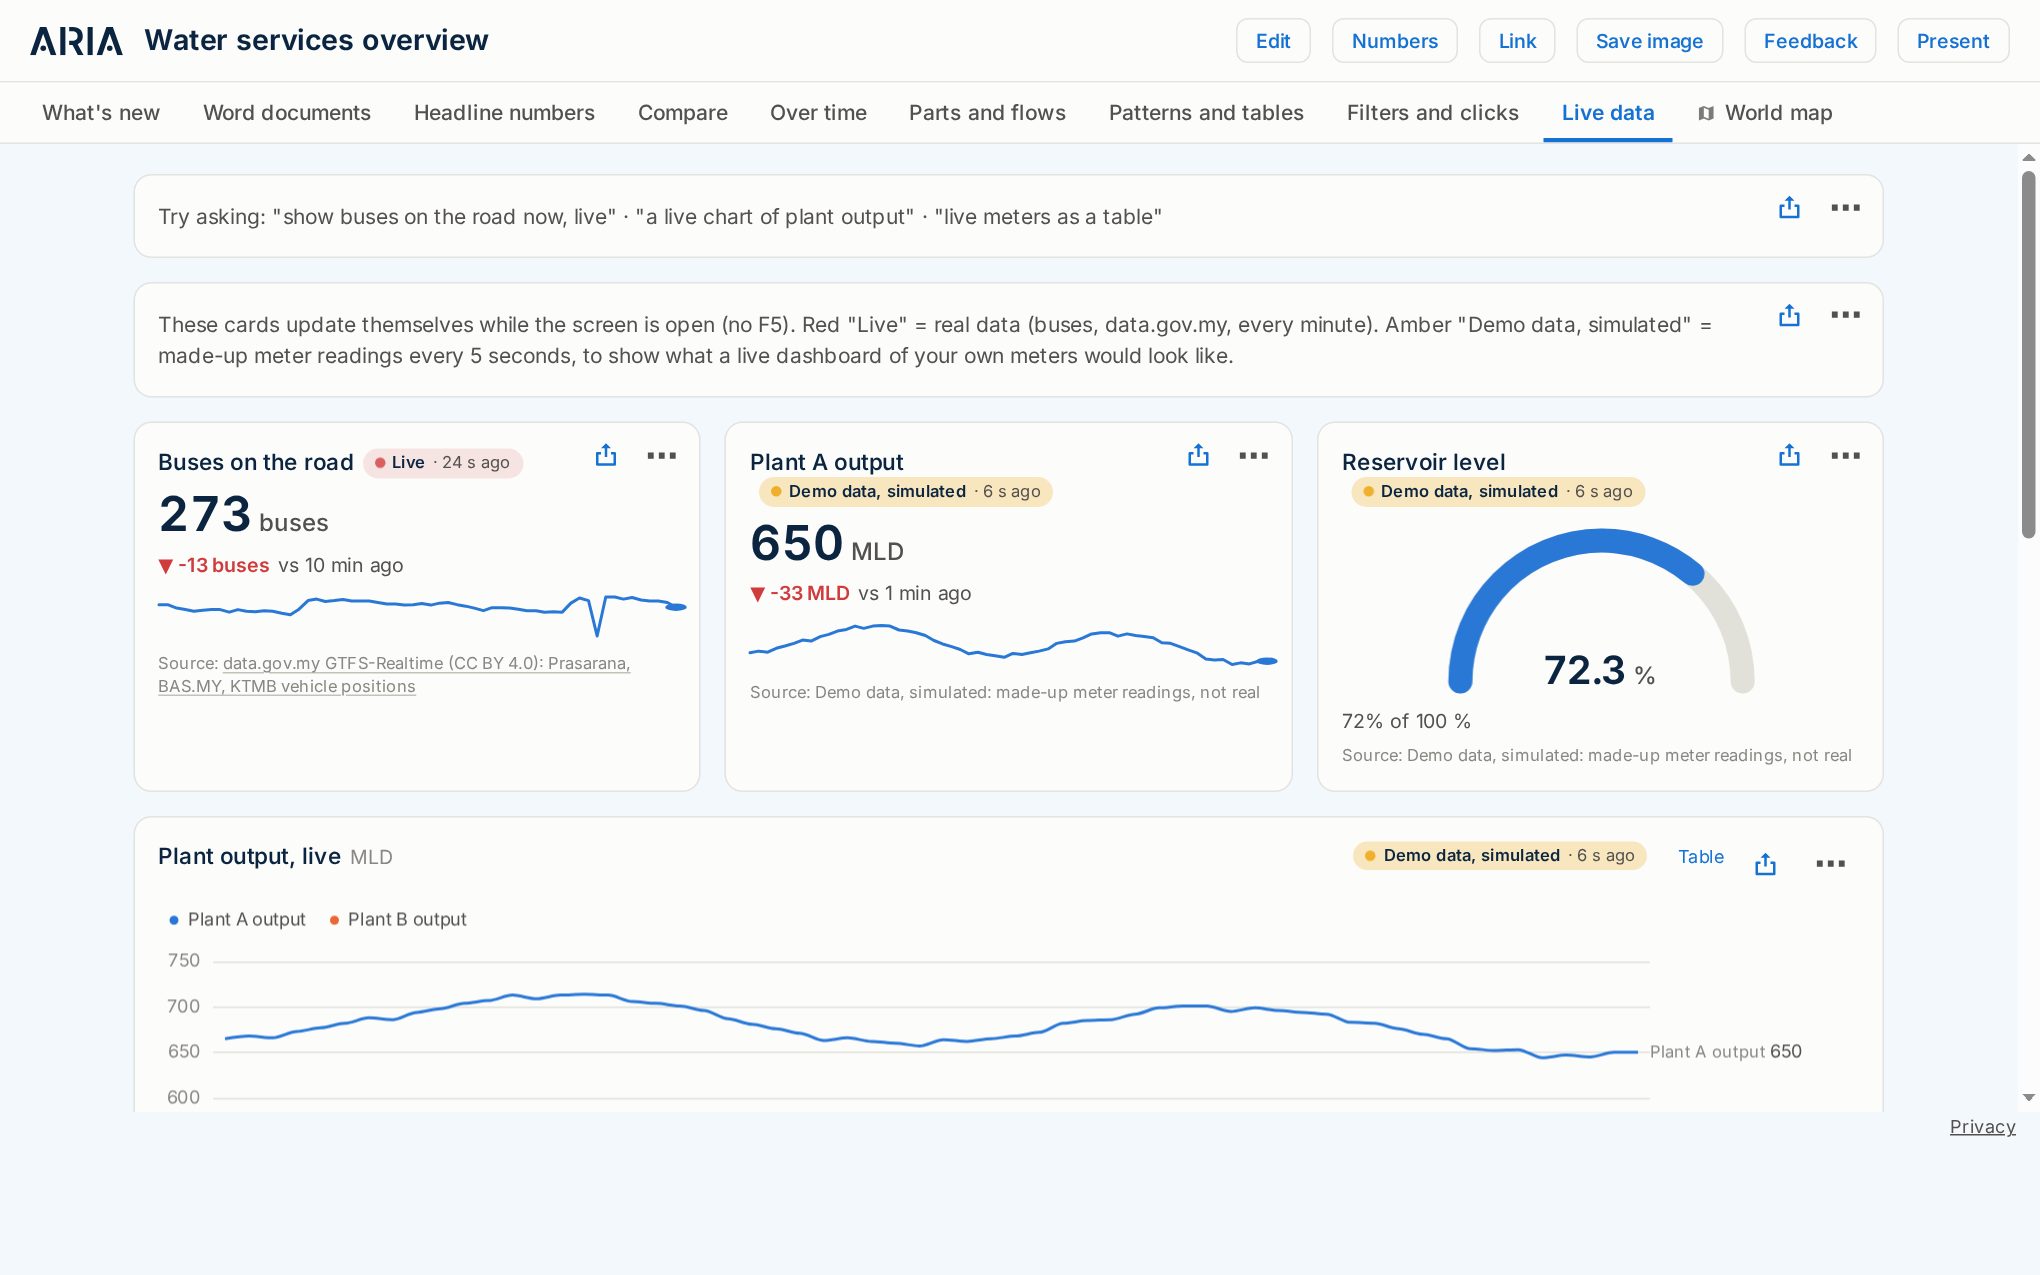
Cards that update themselves while the screen is open: live bus positions from data.gov.my, and your own feeds when they are connected.
The same dashboard on your laptop, your phone and the meeting-room TV. Open Aria on the TV once: it follows whatever your team opens, and a phone can act as its remote.
Drop in Excel or CSV files and photos. Every sheet becomes data you can ask about straight away.
Official open data (data.gov.my, World Bank commodity prices, world energy figures) is ready to ask about.
Every change keeps the version before it. Press Undo, or tell your AI “undo that”.
Picture cards among your charts, and photos in a map pin’s pop-up, from your files or the web.
Publish to your company or as a public link, save a card as a picture, or record it as a video.
When something is missing, tell your AI “send feedback”. It reaches the team with what was on screen.
Aria is invite-only while in beta. Ask for a place, or talk to us about your team.
Already invited? Sign in